规则
正如整体概念中介绍的那样,规则是一种工具,您可以使用它来监视资产并在异常情况或事件发生时得到通知。您可以配置规则以发送电子邮件或在仪表板中通知您的操作员。用例包括:在建筑物中检测到火灾,电梯发生故障或机器逾时维修。规则是可用于配置这些通知的工具。
Senfi中的规则包括:
- 输入-参数和标签值
- 条件
- 结果-真或假,布尔值
- 触发事件-当结果更改时采取措施。例如发送通知电子邮件
- 规则执行选项-配置何时评估规则
输入由条件评估以生成单个布尔结果。当结果的值更改时,诸如发送电子邮件和仪表板警报之类的事件可被触发。 规则执行选项可以让您配置规则的执行方式。例如:评估规则的频率,何时触发事件 等。
输入 --> 条件 --> 结果
结果有所更改 --> 触发事件
Contents
例子
- 输入:iot_weighingscale_v1.battery_level
- 条件: < 20
- 触发事件:发送电子邮件提醒更换电池
- 规则执行选项:立即执行(在有任何测量传入时,评估此规则)
输入,条件和结果
在添加规则之前,您应该已经有想要被受通知的事件或情况。事件或情况必须是能通过监视Senfi接收的数据来检测到的。
选择要从中检测事件或情况的参数和测量作为输入。然后, 构造一组条件 ,当事件或情况发生时这些条件的评估结果为真。所述条件的结果便是规则的结果。
触发事件
只要结果有所更改(从真到假,反之亦然),就可触发事件。可触发的事件包括发送电子邮件,向网络挂钩发送请求或在仪表板中触发警报。
触发事件的内容
根据触发的事件,,可以使用不同的内容选项。一些选项包括电子邮件的标题和正文,以及网络挂钩发送请求的正文内容。您将能够在触发事件的内容中描述通知接收者发生的事件或情况。
为了进一步帮助您描述事件,可以将输入参数的值或标签嵌入到事件的内容中。您还可以在事件的内容中嵌入规则的名称,描述和严重性。
若要镶嵌:
- 参数的值,请使用${<measurement_code>.<metric_code>}。 例如:${iot_temperature_sensor_v1.temperature}
- 参数的标签,请使用${<measurement_code>.<tag>}。 例如:${iot_temperature_sensor_v1.site_id}
- 规则的名称,请使用${NAME}。
- 规则的描述,请使用${DESCRIPTION}。
- 规则的严重程度,请使用${SEVERITY}。
请看这个更详细的例子。
规则执行选项
通过将评估类型设置为立即或轮询,您可以选择在收到任何输入测量的新值时执行规则,或不管任何输入测量是否有更改,定期执行规则。
如果将规则设置为定期运行(轮询),则必须通过以秒为单位设置间隔来指定执行规则的频率。
杂项
名称和描述
规则也有自己的名称和描述。名称和描述允许您描述规则检测到的事件或情况,以使规则的警报/通知的接收者确切知道发生了什么并能够做出相应的反应。
- 规则名称将被显示在内容管理系统的规则列表中。
- 规则的名称和描述将被显示在仪表板上。
您也可以在“描述”中嵌入输入参数的值或标签。使用的语法与嵌入触发事件描述内容的语法相同,如此处所述。
规则描述也是触发事件所使用的默认内容。这样一来,您只需在规则描述里将事件或情况描述一遍,便可以在规则里的各个触发事件重复使用信息。
严重程度
您还可以设置规则的严重程度。默认严重程度为严重。严重程度设置可允许仪表板的用户按严重程度筛选警报,并首先关注更严重的警报。
详细的例子
您想要得到通知的事件是建筑物中潜在的火灾。整个建筑物中都有温度传感器。当任何温度传感器的读数超过60°C时,这意味着传感器附近可能已发生火灾。您希望通过电子邮件收到这种情况的通知。
- 在此示例中,输入将是温度传感器的读数所发送到的参数和测量。 例如:iot_temperature_sensor_v1.temperature
- 条件是 iot_temperature_sensor_v1.temperature > 60
- 触发的事件将会是发送电子邮件,而邮件的正文是:
- "检测到潜在火灾的房间:${iot_temperature_sensor_v1.room}。室内温度为${iot_temperature_sensor_v1.temperature}°C"。
配置了上述规则 后,当iot_temperature_sensor.temperature从59变为61时,将发送一封包含以下正文的电子邮件:
- "检测到潜在火灾的房间: #03-00。室内温度为61°C。"
注意:"房间"是iot_temperature_sensor_v1测量的标签,它指示传感器所在的房间。
Constructing Condition
This section will guide you to construct a condition using the Rule Editor when adding/editing a Rule in the CMS. The objective here is to tell Senfi how to detect the event or situation that you wish to be notified of.
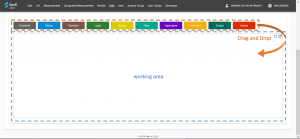
The Rule Editor is a graph based "Drag and Drop" editor. Each node in the Editor represents either an Input, Data Transformation, Logic, or an Action. Arrows are used to link the nodes and control the flow of data between nodes.
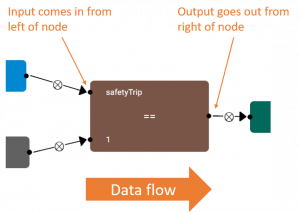
Arrows coming into the left of a node indicates the node's input,
and arrows going out the right of a node indicates the node's output.
The graph must always start from Input nodes and ends in the Result or Action nodes (Data originates from Input nodes, is transformed by Data Transformation, Logic nodes, and is consumed by Result & Action nodes).
- Input nodes
- Metric - outputs the value/s of a metric. can be set to output the last known value, or a range of historical values
- Logic Nodes
- Compare - comparison operators. e.g. <, >=, ==, !=
- Logic - perform "AND" or "OR" between 2 or more boolean values
- Data Transformation nodes
- Filter - used to filter a range of values and output a subset number of values. Can only be used after a Metric node in "Range of Value" mode and before an Aggregate
- Aggregate - used to aggregates a range of values into a single value. E.g. sum, average, median. Can only be used after a Metric node in "Range of Value" mode
- Function - value-wise transformation. Transform each value, e.g ABS, Floor, Round etc. Can be used after a Metric node and before a Compare node. Outputs the same number of values as its input.
- Result node
- Result - Result node. Must have 1 and only 1 node. Specifies the Result of a Rule
- Action nodes
- Action - Action node. Input must always be from the "Result" node. Can have 0 or more "Action" nodes. Instructs Senfi to do something when Result changes.
Basic Steps
- Drag a node above working area into the working area to create a node.
- Create "Metric" nodes, one for each Input metric.
- Select the correct measurement and metric for each "Metric" node. Read: how to configure a node
- (Optional) If you need to compare metric value against a constant value, use the "Constant" node.
- Create "Operator" and "Logic" nodes to construct necessary logic
- logic graph should output a single boolean (true or false) value
- output from "Metric" node must go to input of a "Operator" node.
- "Operator" and "Logic" nodes can be nested.
- You can attach more than 2 inputs to a "Logic" node
- Create a "Result" node and attach output of logic graph as its input
- Create "Action" nodes, one for each desired Action and attach output of "Result" node as its input
- Save when done
Example
Example 1: A simple Rule detecting when a Lift has tripped (safetyTrip == 1).
Example 2: Detects when a Lift tripped (safetyTrip == 1), AND passengers are trapped in the Lift (load > 0)
Working with historical values
When historical values is required to detect an event, the "Range", "Filter" and "Aggregate" nodes are needed.
By default, a "Metric" node will output the Last Known value of the metric. To obtain historical values of a metric, attach the output of "Metric" node to the input of a "Range" node. The output of the "Range" node will be historical values from the metric.
The configuration options of the "Range" node allows you to change the range of historical values to output. E.g: You can configure it to output metric values from 1 hour ago till now, or the last 10 received metric values.
After obtaining the list of historical values, you can:
- Filter the list using the "Filter" node.
- Transform each value in the list using the "Function" node.
The "Filter" and "Function" nodes can be nested.
Finally, the list of historical values must be aggregated using the "Aggregate" node before its output can be used by a "Logic" or "Operator" node.
Example using historical values
The example above detects when a Lift is stopped at Level 2 for over a minute.
Configuring Nodes
Each node contains attributes & options which you can modify. To modify the attributes of a node, move your mouse over the node and click on the "Gear" button that appears near the top right corner of the node (Beside the "X" button). A window will popup to allow you to configure the node.
Aggregate node
This section explains what each of the options for "Aggregate" node does.
- sum
- the sum of all input values
- count
- the number of input values
- average
- the average of input values
- median
- the median value of input values
- max
- the largest value
- min
- the smallest value
- mode
- the value that appears most often
- range
- the difference between the largest and smallest value (max - min)
- stddev
- standard deviation
- percentile
- percentile. This option accepts an additional "Percentile Value" parameter.
- every
- outputs true if every value fulfills the condition. This option accepts an additional "Condition" parameter.
- any
- outputs true if at least 1 value fulfills the condition. This option accepts an additional "Condition" parameter.
Function node
This section explains what each of the options in "Function" node does.
- abs
- absolute value
- round
- round to nearest integer
- ceil
- round up
- floor
- round down
- map
- This option accepts an additional "function" parameter. Using the custom "function" parameter, transforms each input value


