Adding a rule
Contents
Pre-requisites
A rule requires design and logical programing in order for it to work correctly. If this is your first time creating a rule, please read this guide first.
You should also be similar with the basic measurements and its concepts. Please read this section if you require a refresher.
You should
- Know what event the Rule should detect.
- Know what you would like Senfi to do (Action) when the event is detected
- Have already created the Input measurement & metrics.
- Know the thresholds or values which indicates occurrence of event.
- Be able to send records to Input measurement & metric.
- (Optional) Be able to send simulated records to Input measurement & metric (to simulate occurrence of event or situation)
Adding a New Rule
- Login to the CMS
- Go to the Rule tab
- Click the + button to add a new rule.
- Give the rule a descriptive name. This will be shown to users of the dashboard.
- Select the Severity of the rule.
- Select Evaluate Type of the rule. Read this section if you require a refresher
- (Optional) Select the Access Group that would be able to view and modify the rule. Defaults to all users in your organization.
- Give the rule a descriptive Description. The Description would be the default content for any Action
- Construct the Conditions using the editor. Constructing the Condition for more details.
- Save when done
- (Optional) Send records to simulate event to test the rule.
Constructing Condition
This section will guide you to construct a condition using the Editor when adding/editing a Rule in the CMS. The objective here is to tell Senfi how to detect the event or situation that you wish to be notified of.
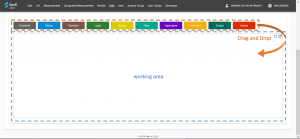
The Rule Editor is a graph based "Drag and Drop" editor. Each node in the Editor represents either an Input, Data Transformation, Logic, or an Action. Arrows are used to link the nodes and control the flow of data between nodes.
Arrows going into the left of a node indicates the node's input,
and arrows flowing out the right of a node indicates the node's output.
The graph must always start from Input nodes and ends in the Output or Action nodes (Data originates from Input nodes, is transformed by Data Transformation, Logic nodes, and is consumed by Output & Action nodes).
- Input nodes
- Constant - outputs a constant value. e.g: 0, 1, true, false
- Metric - outputs the latest value of a metric
- Input modifier nodes
- Range - modifies output of "Metric" node from latest to historical values
- Logic Nodes
- Operator - comparison operators. e.g. <, >=, ==, !=
- Logic - perform "AND" or "OR" between 2 or more boolean values
- Data Transformation nodes
- Filter - to be used with "Range" node. Filters input values to output a subset number of values.
- Aggregate - to be used with "Range" node. Aggregates input values into a single value. E.g. sum, average, median.
- Function - value-wise transformation. Transform each value, e.g ABS, Floor, Round etc. Can be used directly with a "Metric" node, or with "Range" node. Outputs the same number of values as its input.
- Output node
- Output - Output node. Must have 1 and only 1 node. Specifies the Output of a Rule
- Action nodes
- Action - Action node. Input must always be from the "Output" node. Can have 0 or more "Action" nodes. Instructs Senfi to do something when Output changes.
Basic Steps
- Drag a node from the top of the working area into the working area to create a node.
- Create "Metric" nodes, one for each Input metric.
- Select the correct measurement and metric for each "Metric" node. Read: how to configure a node
- (Optional) If you need to compare metric value against a constant value, use the "Constant" node.
- Create "Operator" and "Logic" nodes to construct necessary logic
- logic graph should output a single boolean (true or false) value
- Create a "Output" node and attach output of logic graph as its input
- Create "Action" nodes, one for each desired Action and attach output of "Output" node as input
- Save when done
Working with historical values
When historical values is required to detect an event, the "Range", "Filter" and "Aggregate" nodes is needed.
By default, a "Metric" node will output the Last Known value of the metric. To obtain historical values of a metric, attach the output of "Metric" node to the input of a "Range" node. The output of the "Range" node will be historical values from the metric.
The configuration options of the "Range" node allows you to change the range of historical values to output. You can configure it to output metric values from 1 hour ago till now, or the last 10 received metric values.
After obtaining the list of historical values, you can:
- Filter the list using the "Filter" node.
- Transform each value in the list using the "Function" node.
The "Filter" and "Function" nodes can be nested.
Finally, the list of historical values must be aggregated using the "Aggregate" node before its output can be used by a "Logic" or "Operator" node.
Configuring Nodes
Each node contains attributes & options which you can modify. To modify the attributes of a node, move your mouse over the node and click on the "Gear" button that appears near the top right corner of the node (Beside the "X" button). A window will popup to allow you to configure the node.
TODO: go through each node and what each configuration option does

